
Find the workload that fails next — while it still looks healthy.
Every running workload is scored continuously against 200+ rules. 49 correlation engines check its config against live telemetry, which a manifest scanner can't do.
one helm install · get, list, watch only · first findings in minutes
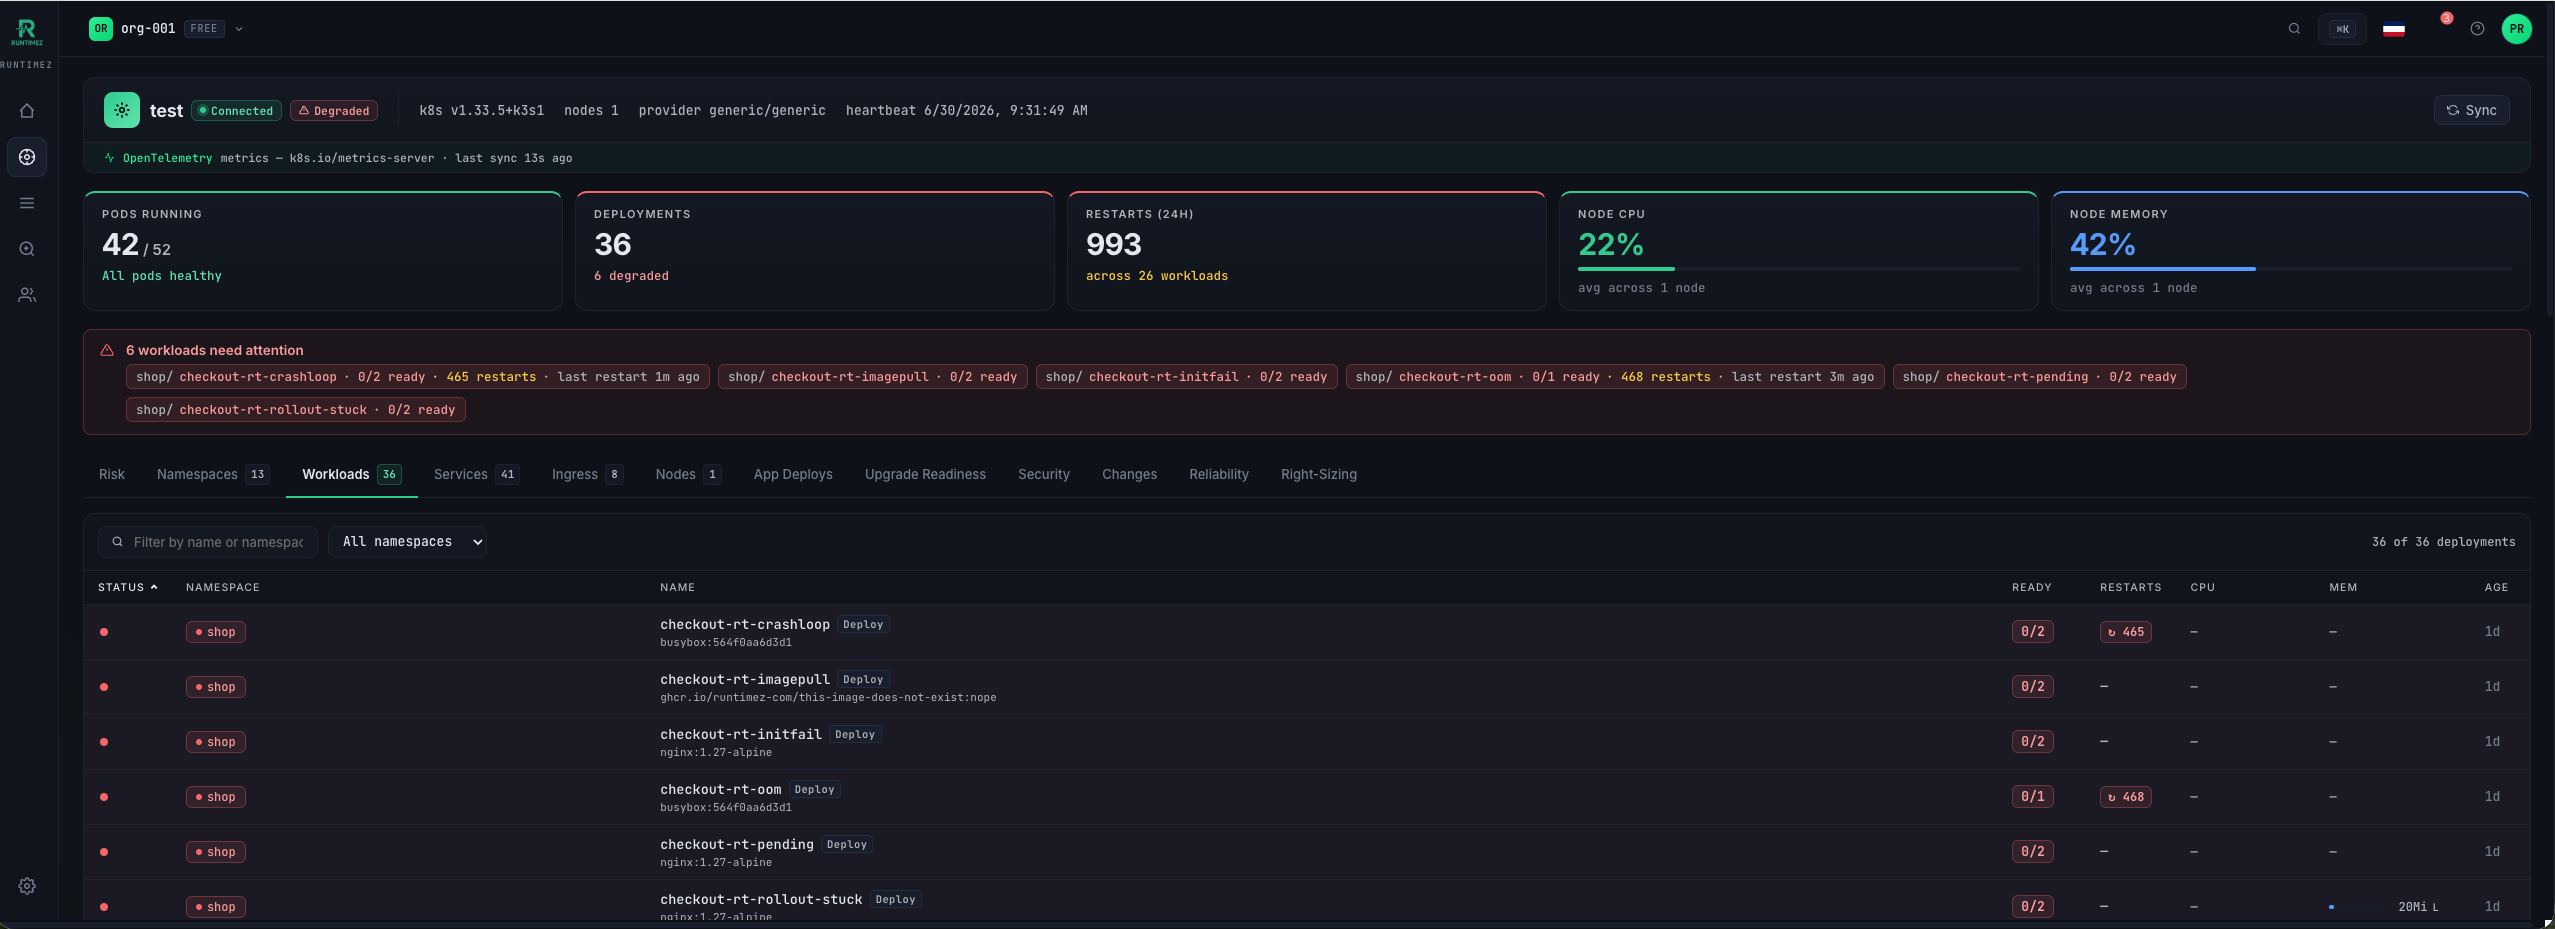
Live workload risk
The daily value: a ranked list, not a one-shot scan.
Continuous scoring
Every running workload is scored on runtime health, spec hygiene, resource sizing, security, change history and add-ons.
Config checked against telemetry
Examples: an HPA denominator mismatch, a PDB that blocks its own drain, a probe timeout versus the real p95, a grace period versus in-flight requests, a limit cut below observed usage.
Failure-scenario verdicts
PASS, AT_RISK, WILL_FAIL or WILL_STALL under node failure, AZ failure and maintenance, each with a plain-English reason.
Dependency blast radius
Uses observed call volume to show who else goes down with this workload.
Autoscaler verdicts, verbatim
Shows FailedGetResourceMetric and similar HPA errors before the autoscaler silently stops scaling.
Every finding explained
Each finding comes with its evidence, the rule that fired and a fix. Findings are ranked fix-first across reliability, security and upgrade risk.
Add-on workspaces
One tab per detected add-on. Each uses the add-on's own vocabulary and verdicts and links straight into root-cause analysis.
GitOps · Argo CD
Every Application with its sync and health state. NOT_SYNCING is explained in 31 deterministic rungs read from Argo CD's own messages. 39 rules catch problems that would hit at the next sync.
Ingress · Traefik
Every route with Traefik's own router verdict, the backends it resolves to, and live request counters. 44 rules, including routes that no backend serves.
Autoscaling · Karpenter + Cluster Autoscaler
NodePools with limits vs. usage, NodeClaims and disruption events. Cluster Autoscaler node groups get a banner when the scaling loop goes stale. 19 rules, including nodes that fail to register.
Service mesh · Istio
Routed workloads, traffic counters that a sidecar restart can't inflate, and Envoy response flags per edge. 24 rules, including fault injection left on and mTLS mismatches.
The evidence layer
Uses your telemetry as evidence. It is not a Datadog replacement.
Tracing, logs and metrics
Distributed traces in waterfall, DAG and scatter views; an observed service graph; logs with AI summaries; a metrics explorer with tag search.
Zero-code instrumentation
OTel SDKs injected by policy with no operator, a Go eBPF sidecar, and eBPF traces as a fallback for everything else.
Right-sizing
Compares requests and limits to observed usage per container. Under-requested containers are your next OOM; over-requested ones are your bill.
Telemetry cost controls
Log drop and sample rules with a live preview, trace sampling in shadow mode, and a metrics cardinality view, so the bill doesn't surprise you.
How it compares
They check config against best practice. Runtimez checks config against your live telemetry.
They tell you what broke. Runtimez tells you what will break, and why it broke, with citations.
One agent, the rest of the platform
Every product runs off the same read-only sweep and feeds the same ranked queue.
See it on your own cluster in under an hour.
Free for your first cluster. Read-only by default. Uninstall is one helm command.